Estimated reading time: 8 minutes
By Robert Vietzke, Internet2 Vice President, Network Services
Many community members have asked how the sudden move of students, faculty and staff from our nation’s educational facilities to their homes have impacted Internet2 and other R&E networks. Days into this massive change, we’re already seeing some interesting trends that confirm the critical role R&E networks play even as we work to support this new role within the Internet ecosystem. One thing is clear: R&E networks are carrying a significant load in this new paradigm, even as our campuses and schools are shuttered. R&E networks are still supporting research and are a key part of the ecosystem for remote learning, academic medicine and work-from-home administration. We look forward to continuing our partnership and supporting the needs of the community in 2021.
Internet2 has been highly active during the past two weeks in supporting the changes detailed in this report. We want to be part of the solution for our campus, district and regional members and are working aggressively to augment parts of the network that are being exercised in new ways during the pandemic. For example, we’ve increased our capacity to Zoom by almost tenfold and are actively working with home broadband providers to assure VPN traffic has a high-performance path from the home to the campus as it continues to grow.
Overall, the story is one that the R&E community can be proud of. We have responded to a massive change, have absorbed it, and are now fine tuning and addressing additional needs to assure that everyone from our pandemic researchers, to our university students, to our K12 students are well served by our part of the Internet ecosystem.
Exploring Traffic Growth & Change in the New Environment
To explain how Internet2’s role in the ecosystem has changed, we’ve been looking at several views of traffic on the Internet2 national backbone. These trends are just the national backbone part of the ecosystem and we can expect that regional networks are also seeing similar trends, possibly at different scales in each region. Essentially what Internet2 sees is just the tip of the iceberg that is above water in terms of the whole ecosystem’s activity.
First, we can look at Internet2’s overall traffic load. In a typical busy academic day this semester, Internet2 has been moving as much as 9 petabytes of data per day. During the Winter 2019/2020 break, we were moving about 3.5 petabytes per day. Of particular interest since most of our campuses and K12 schools have closed, we are still moving 4-5 petabytes per day of traffic. This is higher than our winter break time when many campuses are equally empty.
The traffic we are moving can be broken down by service categories that Internet2 supports. The classic Research and Education service that Internet2 has offered since its inception and that connects K12 schools, campuses, international partners and government affiliates is still moving 80% of the traffic that it did before the campus and school shutdowns. Even with students off campus and at home, we are still seeing 80% of the traffic we saw before the changes on our networks.
Another service Internet2 has offered as a low-cost value add to the core research network mission is the Internet2 Peering Exchange (I2PX). This service connects campuses and schools to commercial peering entities ranging from home broadband providers to commercial cloud providers. This is how campuses connect to Google, Microsoft, Amazon and it includes both cloud computing for research and also residence-hall YouTube and Amazon Prime video. I2PX is often augmented by additional peering at the regional level, indicating that Internet2 only sees a portion of the traffic change that a regional may see.
In terms of this I2PX peering traffic, we are seeing only 51% of the traffic we were seeing when the residence halls were occupied. This is an understandable change given the exodus of hundreds of thousands of students from campus residences to home environments and the related drop in educational living.
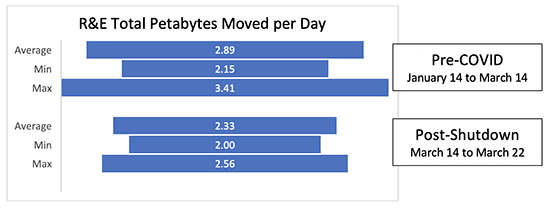
When viewed as total traffic moved for all services, the overall change to our traffic is a reduction of 34%. During the beginning of the academic semester, we saw an average of 7.32 PB/day in traffic with peaks as high as 9.4 PB. With campuses closed, traffic is down to an average of 4.86 PB/day with peaks of 5.45 PB across all services.
Types of Traffic Across the Backbone
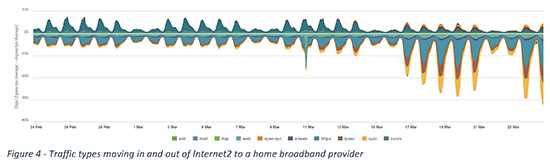
We are also tracking how the types of traffic on the network are changing in this new environment. For example, our “science traffic”(traffic that our analytics tool identifies as science-related applications and science-related compute nodes) remains very consistent during this change. We see a reduction in “video,” “social” and “games” reflecting the exodus of personal student use in residence halls. The catch-all category of “web” includes both personal and research uses and generally reflects the smaller population on campuses.
Anecdotally, we have heard that academic medical centers are expanding their sharing of COVID-related research data in pursuit of new testing, vaccine and support discoveries. Some of that traffic may be “science,” but it could just as easily be within the VPN, web, or storage categories due to the imperfect analytics algorithms and a rapidly changing environment. (We’d love to hear about example uses of the network supporting COVID activities in your environments. Send us a note at networkdevelopment@internet2.edu if you have a story that should be told!)
Diving Deeper: Notable Changes to Individual Peer Connections
Beyond the aggregate traffic patterns, Internet2 is also watching individual connections to home broadband providers and key content providers. The connections to these peers are the “bridge” between our highly tuned R&E networks and the commercial networks that support individual homes and cloud providers and are likely to be stress points as traffic changes.
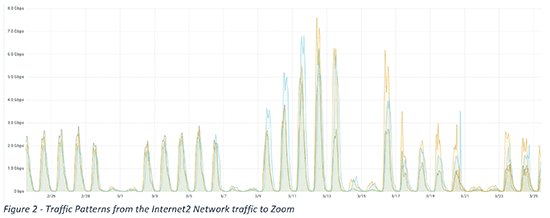
Of particular interest are connections to Zoom, Bluejeans, Microsoft and Cisco collaboration platforms. The one that has shown the most dramatic change for the R&E community is Zoom, which has been absorbing a massive influx of new users in new locations. Internet2 and Zoom both saw a significant spike last week and immediately agreed to increase capacity by tenfold. In addition, Zoom migrated much of its workload to Amazon, reducing the overall load on their private connection with Internet2 and leveraging multiple large connections already in place with Amazon.
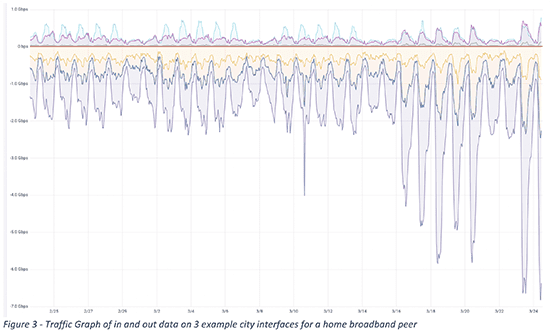
Related to home broadband providers, we have seen tremendous growth in the past two weeks. For one national cable company, our 7 links that were averaging a peak of 4 Gbps now have several interfaces that are nearly full at 9.5 Gbps during daily peaks. Internet2’s peering team has been in active conversations with this and other home providers and reached agreements to make tenfold increases in capacity across the country in the coming days and weeks. Both teams are also actively monitoring and managing traffic on each individual port to avoid packet loss while capacity augments are underway. The collaboration with these commercial peers has been excellent and both the Internet2 and commercial teams are expediting timelines to stay ahead of emerging demand.
We are also watching traffic to the major cloud providers that provide both compute and consumer services. Internet2 now has hundreds of gigabits of additional capacity on these connections after recent expansions completed several months ago. We are seeing no significant impact on these upgraded connections.
Similarly, connections to learning management providers popular in the community look to be in good shape in the new environment.
Related articles and blogs: